
In the previous article 6 steps to integrate Application Insights with .Net Core application hosted in Azure App Service, we have learnt how to integrate Azure Application insights with a .Net Core WEB API.
In this article, we will learn about Live Metrics feature of Azure Application Insights.
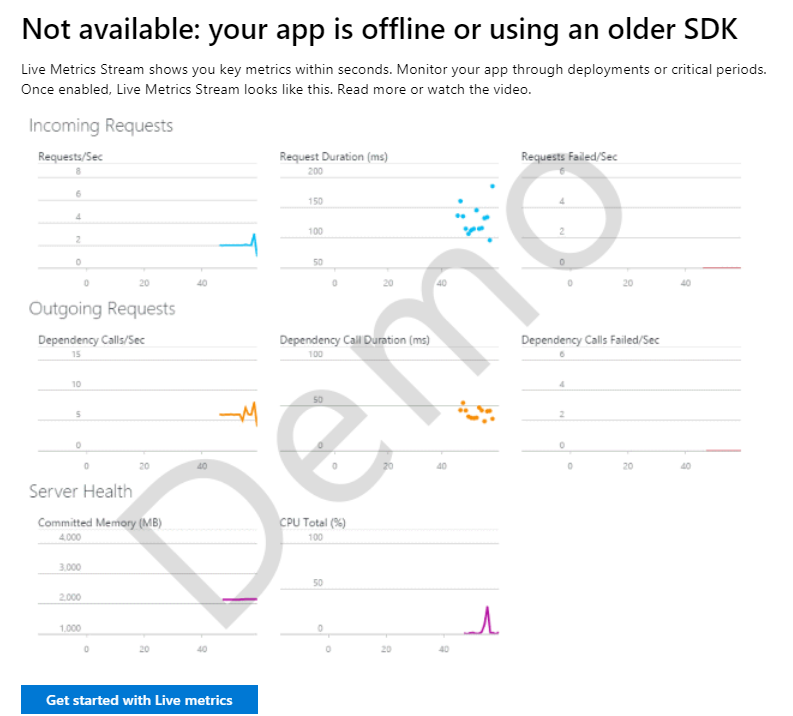
Note: Live Metrics works only
- If you have created a new Application Insights and not yet integrated with any application yet.
- If the application is not on-line and is not currently serving the requests.
- If the application is using the older version of Application Insights SDK <2.6
- In case if your application is running in an On-Prem environment, make sure you allow the related ports. Refer the official documentation for more information about the ports. https://docs.microsoft.com/en-us/azure/azure-monitor/app/ip-addresses#outgoing-ports
Otherwise, you would see something as shown below.
Live Metrics provide you the live traffic information, Errors and some telemetry information about the application(s) associated with the Application Insights service.
Below is the information that you can get from Live Metrics.

Each of the above features are displayed in a collapsible pane. Each section displays the data for the last 60 seconds. The request data after 1 minute will be discarded. It doesn’t store any historical data.
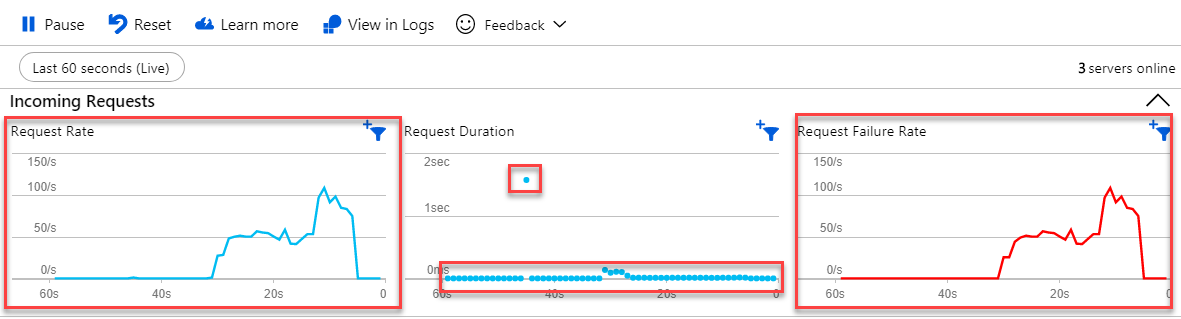
Incoming Requests
This section shows all the information about Incoming requests.
- Request Rate – Number of requests that the application is receiving.
- Request Duration – The average request duration time
- Request Failure Rate – The failures in the last 60 seconds
Below is the screenshot which shows all the above information.
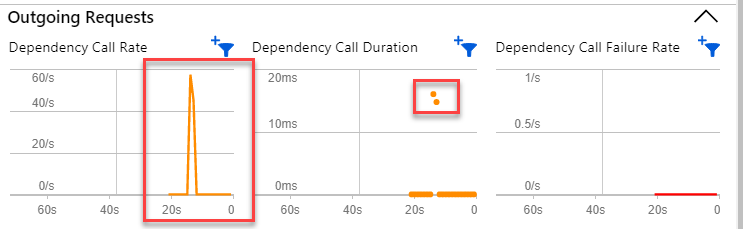
Outgoing Requests
This section shows all the information about Outgoing requests. In general, all the outgoing requests are dependency calls.
- Dependency Call Rate – Number of Dependency / outgoing calls that our application is making per second.
- Dependency Call Duration – The response time of the dependency service. In the below screenshot, it was a a request to a Storage Account.
- Dependency Call Failure Rate – Exceptions / Failures if any.
Servers
This section provides some important insights (like CPU %, number of requests per server etc.) about the number of servers in which your application is running. In the below screen capture, it shown three servers which are online.
The below screenshot shows two servers (1st and 3rd) created for Azure Functions and one (2nd) for App Service Web App.

In case if you don’t see all the fields shown in the above screenshot, you can click on the Select Columns drop down and choose the fields that you are interested in as shown above.
Overall Health
This section provides overall health of the servers in which the application(s) are hosted.
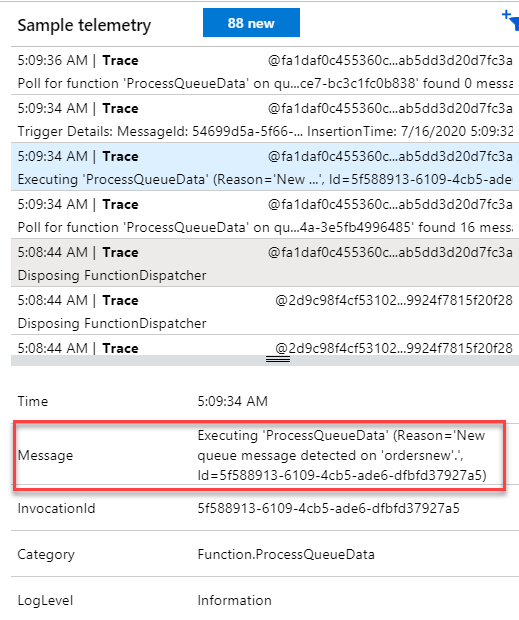
Sample Telemetry
This section displays the live telemetry as shown below. This view doesn’t get refreshed automatically. In case if you don’t see your logs, click on the <X new> button shown below.
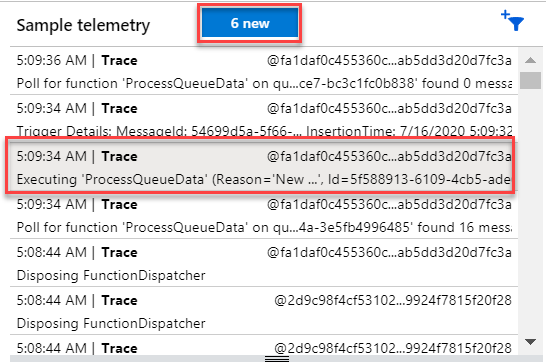
Choosing any of the logs shown above will show more details in the below section as shown below.
The Telemetry logs can also be filtered based on the Server. Below are two examples.
Filter all the Web Server Logs
As shown below, I have selected App Service’s server. The Sample Telemetry shows only the Live Traffic logs related to App Service
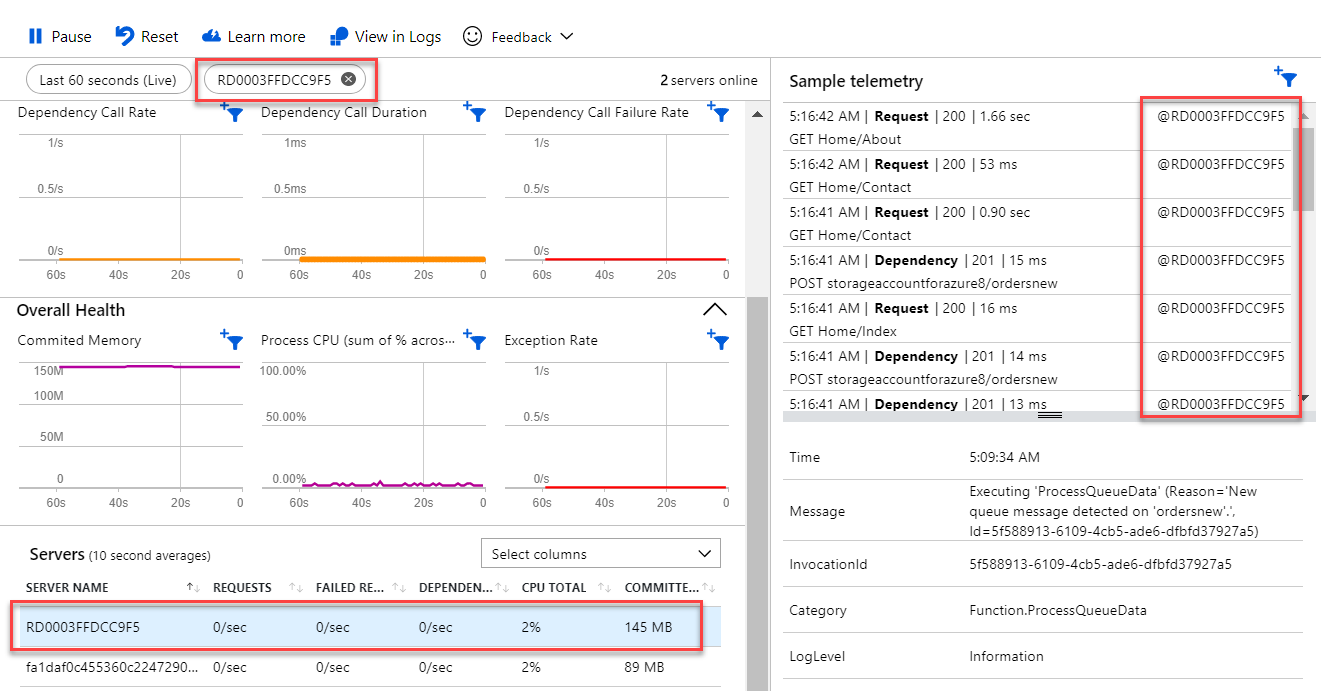
Filter all the Azure Function Logs
As shown below, I have selected Azure Functions’ server. The Sample Telemetry shows only the Live Traffic logs related to Azure Functions.

When you have multiple services, this feature of filtering the telemetry based on the server will definitely be helpful for troubleshooting the errors and fixing them quickly.
That’s it, we have learnt how to leverage the Live Metrics feature of Application Insights.
Note: Live Metrics are displayed instantly, however, the other telemetry is not shown immediately, it might take 2 to 5 minutes. The reason for this is that that Live Metrics Stream and the regular Telemetry use different Application Insight’s Channels. More on the Application Insight Channels will be discussed in the upcoming articles. Stay tuned 🙂
Happy Learning.
Do you like this article? If you want to get more updates about these kind of articles, you can join my Learning Groups
Discover more from Praveen Kumar Sreeram's Blog
Subscribe to get the latest posts sent to your email.

One comment