In this article, we are going to learn how to find performance issues in a .Net Core 3.1 application hosted in Azure App Service – Linux environment
Note: Profiling for apps hosted in Linux app service plan is in preview at this time of writing.
Create the following services in a Resource Group.
| Service Type | Comments |
| Azure App Service | Runtime Stack – .Net Core 3.1 |
| Azure App Service Plan | OS: Linux Pricing Tier: Standard or Higher |
| Azure Application Insights | Once created, Capture the Instrumentation Key from the Overview blade |
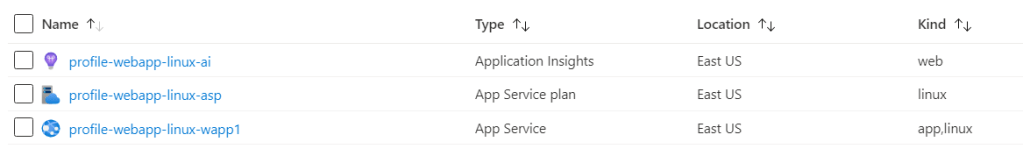
I have created the above services in a Resource Group as shown below.
Once you all the services provisioned, link the Application Insights instance with the App Service so that the App Service can push the application telemetry to the Application Insights instance. We can link both of them by creating a Key named APPINSIGHTS_INSTRUMENTATIONKEY and paste the IKey as shown below.

Create a .Net Core Web application and install the below Nuget Package

Navigate to the Startup class and register the below service in order to enable Application Insights along with the profiler.
services.AddApplicationInsightsTelemetry(); // Enable Application Insights.
services.AddServiceProfiler(); // Enable the Profiler for the application
The Configure method should like this once you add the above lines of code.

Let’s now add some code in the application that simulates some performance issue. Navigate to any action method and add the below code that makes your app run slow.
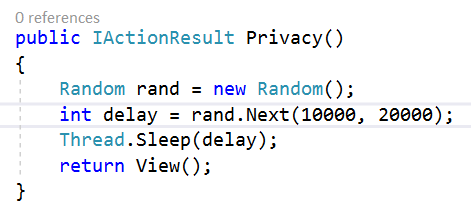
The above code added a sleep time between 10 to 20 seconds whenever you access the Privacy page. Let’s go ahead and deploy the application to Azure App Service
Once the application is deployed, you should be able to navigate to the page by clicking on the Browse button in the Overview page of the App Service.
You might notice slowness when you navigate to the Privacy page as we have used Thread.Sleep. However, in real-time, there might be various reason why an endpoint would be slow. As a developer, one might be interested in identifying the exact method which is taking more time. Let now understand how to identify those slow performing components.
Enable Profiler in Application Insights
Navigate to the Application Insight’s Performance Blade and click on the Profile button as shown below.

It takes you to another blade which shown all the profiling sessions. Click on the Profile Now button to initiate the Profiling process as shown below.

Once you click on click on Profile now button, you will see a new blade open which give some info about the progress of the profiling.

While this is happening, you need to simulate traffic on your web app. Basically, when you initiate the process, the required agents will be installed on the App Service instance and it the profiler will start the process of collecting the metrics and it pushes to the Application Insights instance. By default, it runs for 120 seconds. So, during that period it collect the metrics of the requests. If there are no requests during that period you don’t see any data.
Sometimes, the Profile process would get timed out with the message Profiling timeout. Refresh and try again as shown below.

In such cases, you should ensure that you are using Standard Pricing tier or higher for the App Service Plan.
Note: As per Microsoft, Profiler works from Basic tier onwards. However, I couldn’t get it to work with Basic pricing tier.
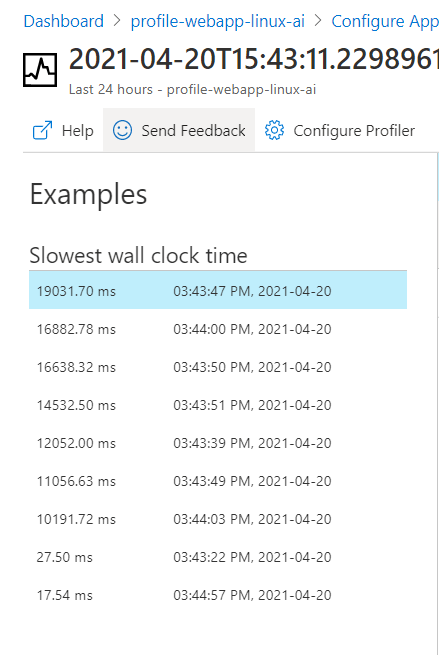
Once you ensure that you are using Standard pricing tier, you can retry the Profiling again. If the profiling is successful, then you would see the sessions in the Profile listing as shown below.

Click on the OnDemandSchedulingPolicy item which will provide more details as shown below.
Clicking on any of the items shown above will provide more details about the entire tree of how the various components are execute as shown below.
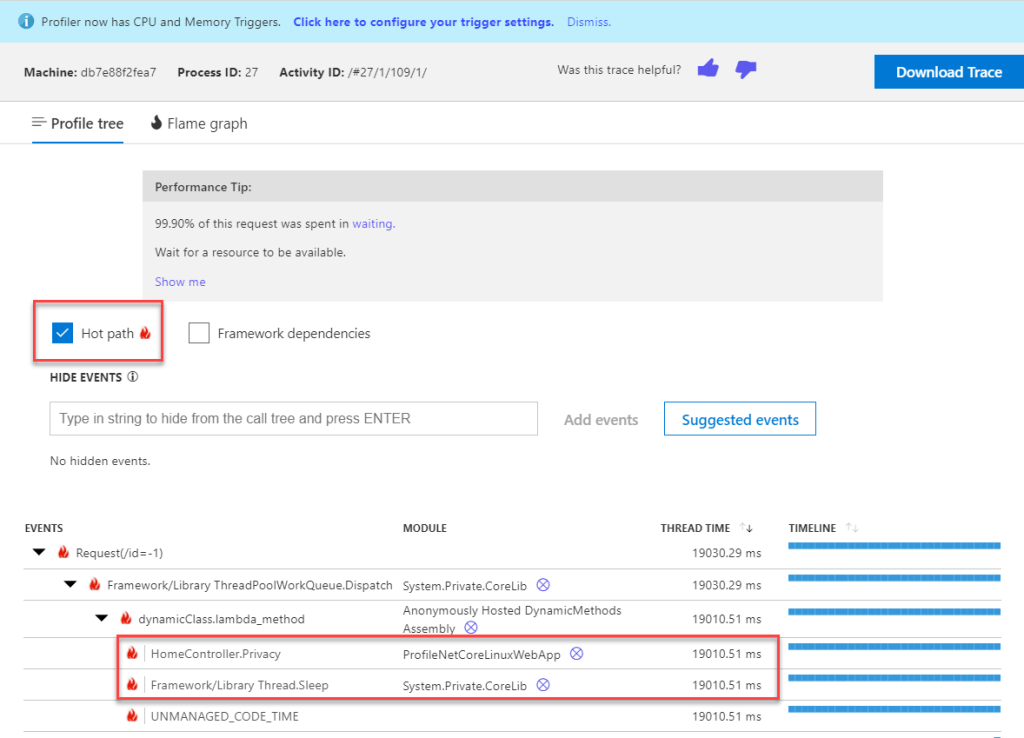
As shown in the above screenshot, it clearly shows us that the Privacy action method of the HomeController is the culprit which is taking lot of time.
The above Profile tree clearly provides us information about which components are taking more time. In this way, we can easily identify the components that are taking more processing time which helps the developers isolate the problem and fix it.
That’s it. In this article, we have learnt how to profile the .net core application hosted in Linux web apps. Hope it helps.
Happy Profiling.
Do you like this article? If you want to get more updates about these kind of articles, you can join my Learning Groups
Discover more from Praveen Kumar Sreeram's Blog
Subscribe to get the latest posts sent to your email.
